Let’s face it: investing in Massachusetts real estate can sometimes feel like trying to win a marathon while hopping on one foot—in snow. But if you know where to look (and how to jump through all those regulatory hoops with style), the rewards are still very real.
In this research-based deep dive, we’ll unpack the latest data, market trends, and regional hot spots that are shaping Massachusetts’ fix-and-flip and ground-up construction scene in 2025. Whether you’re a seasoned developer, a house-flipping pro, or just real estate-curious, this article will arm you with the insights you need to make smart, strategic plays in one of the country’s most regulated—and rewarding—markets.
The Big Picture: Massachusetts Post-COVID Housing Market
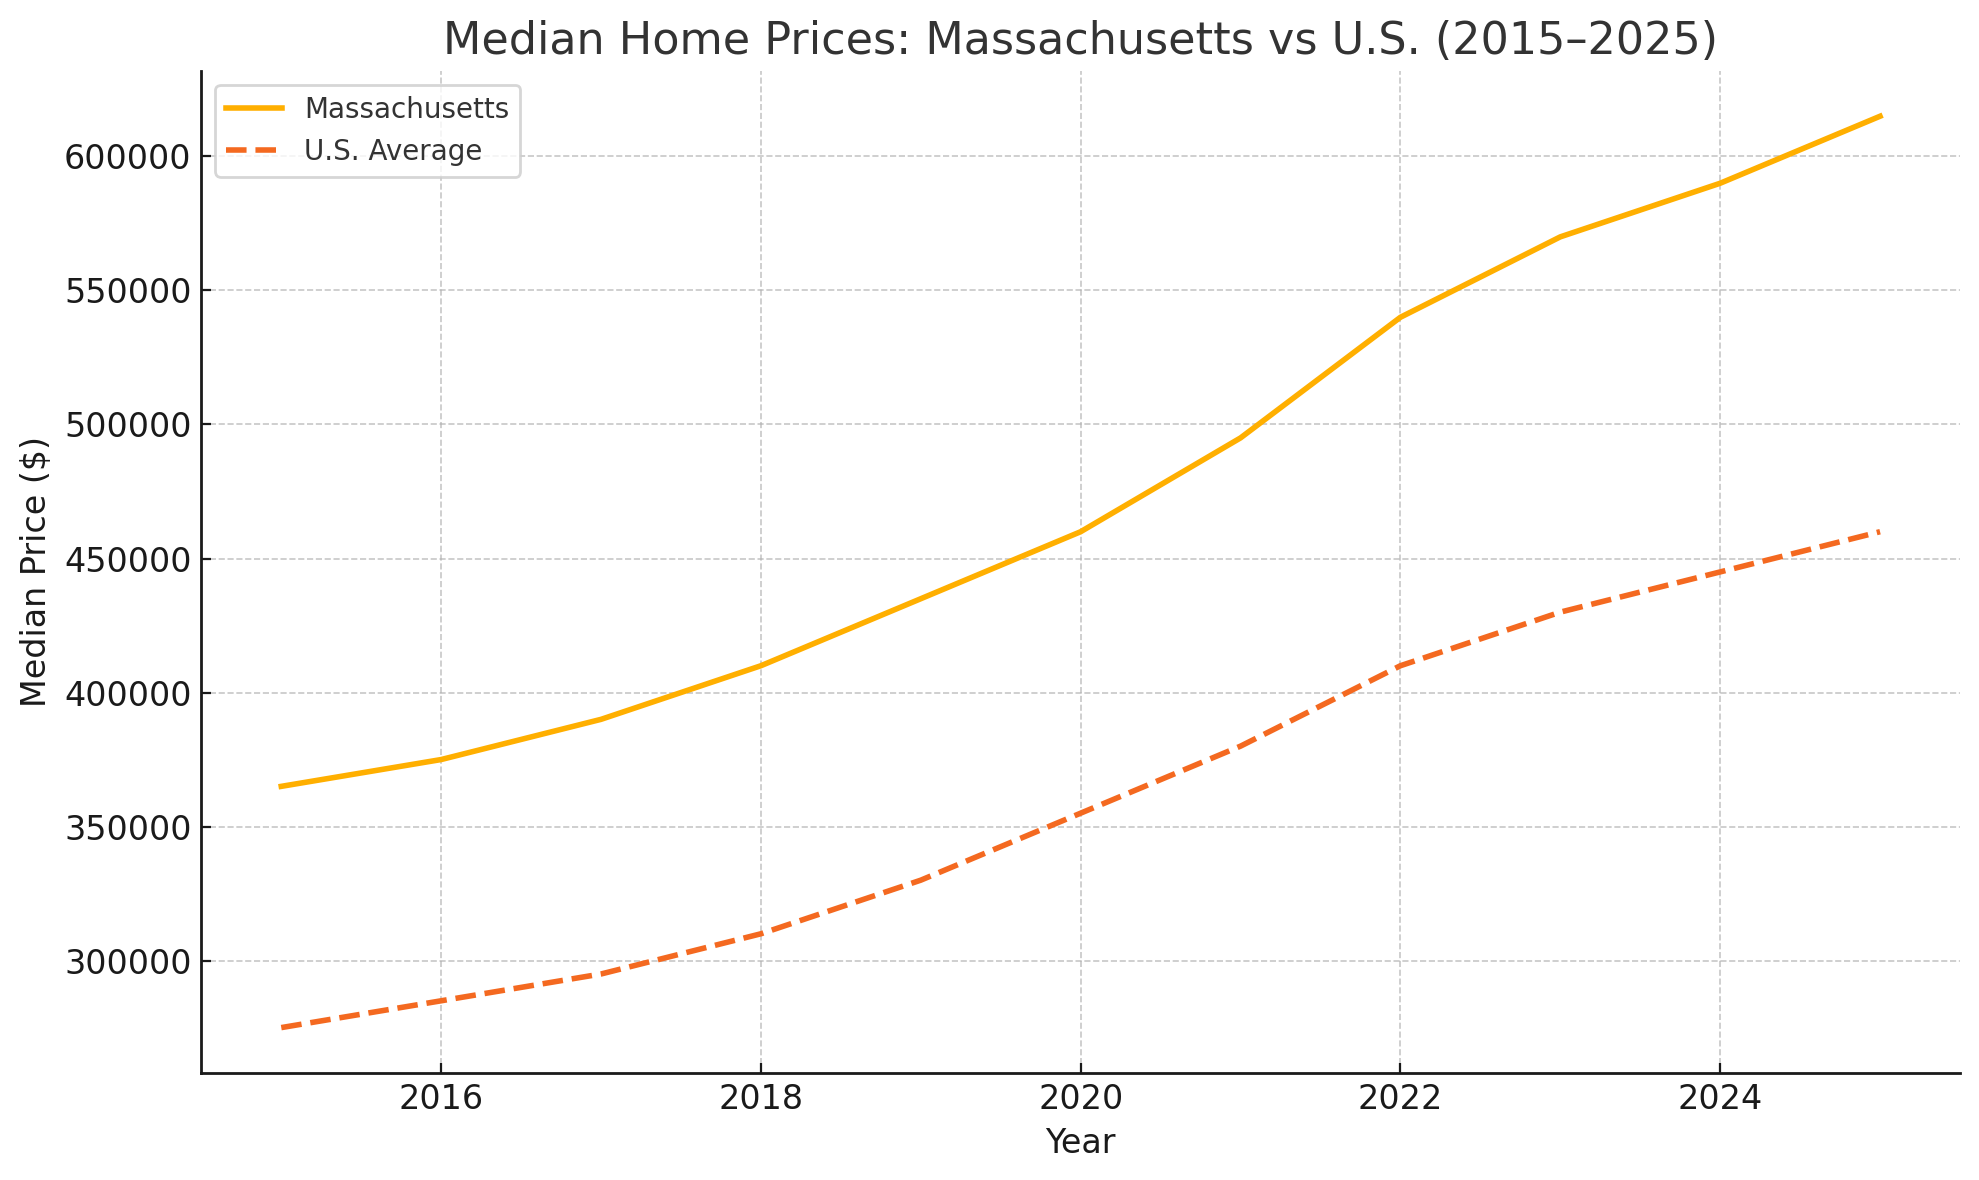 Post-pandemic Massachusetts hasn’t just recovered—it’s turbocharged. The statewide median single-family home price hit an all-time high of $615,000 in early 2024, up 7.9% from the previous year. Meanwhile, rental vacancy rates dropped to a jaw-clenching 2.5% (the lowest in the nation), and the state now boasts the third-highest median rent in the U.S. at $2,264.
Translation? People want to live here. There just aren’t enough homes to go around.
And that’s not just a Boston thing. Smaller cities like Worcester and Springfield are seeing above-average price growth too. In fact, Springfield was named the hottest housing market in the country in late 2024. Cue the Western Mass property gold rush.
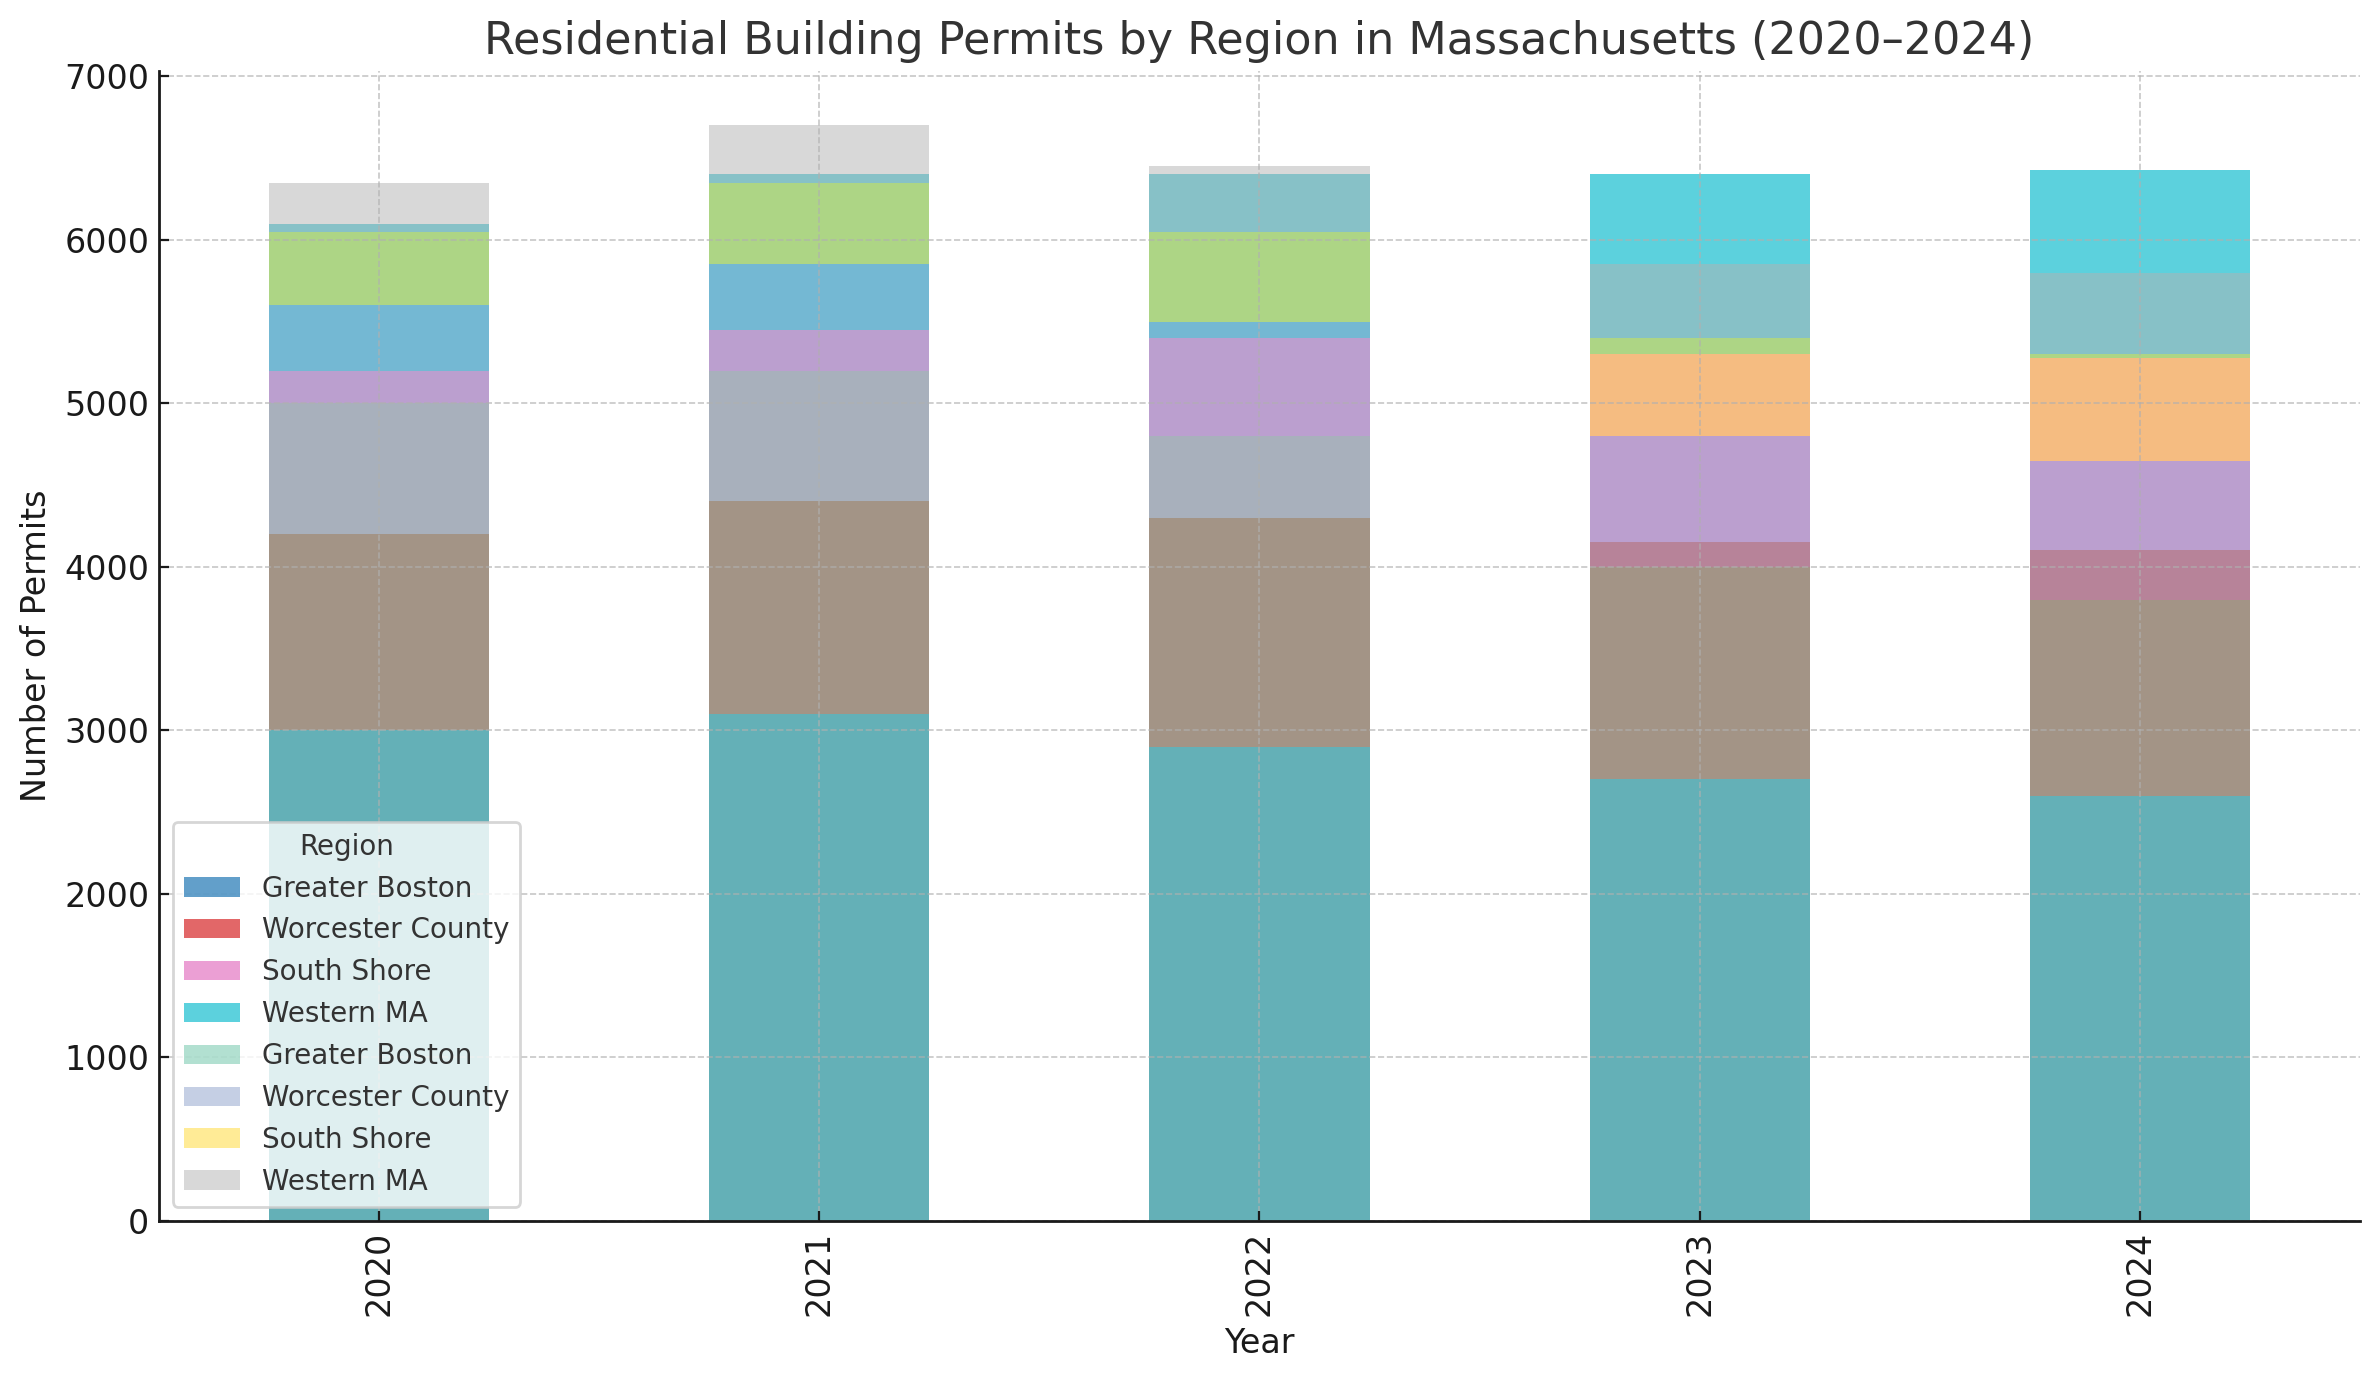
Yet new housing production isn’t keeping up. Massachusetts permitted only about 2.5 homes per 1,000 residents in 2022—half the national rate. With demand far outpacing supply, the conditions are ripe for both flippers and builders willing to navigate the state’s red tape.
Fix and Flip in Massachusetts: Still Kicking (and Profitable)
Massachusetts might not top the charts for flip volume (leave that to Florida and Texas), but what it lacks in quantity, it makes up for in quality returns.
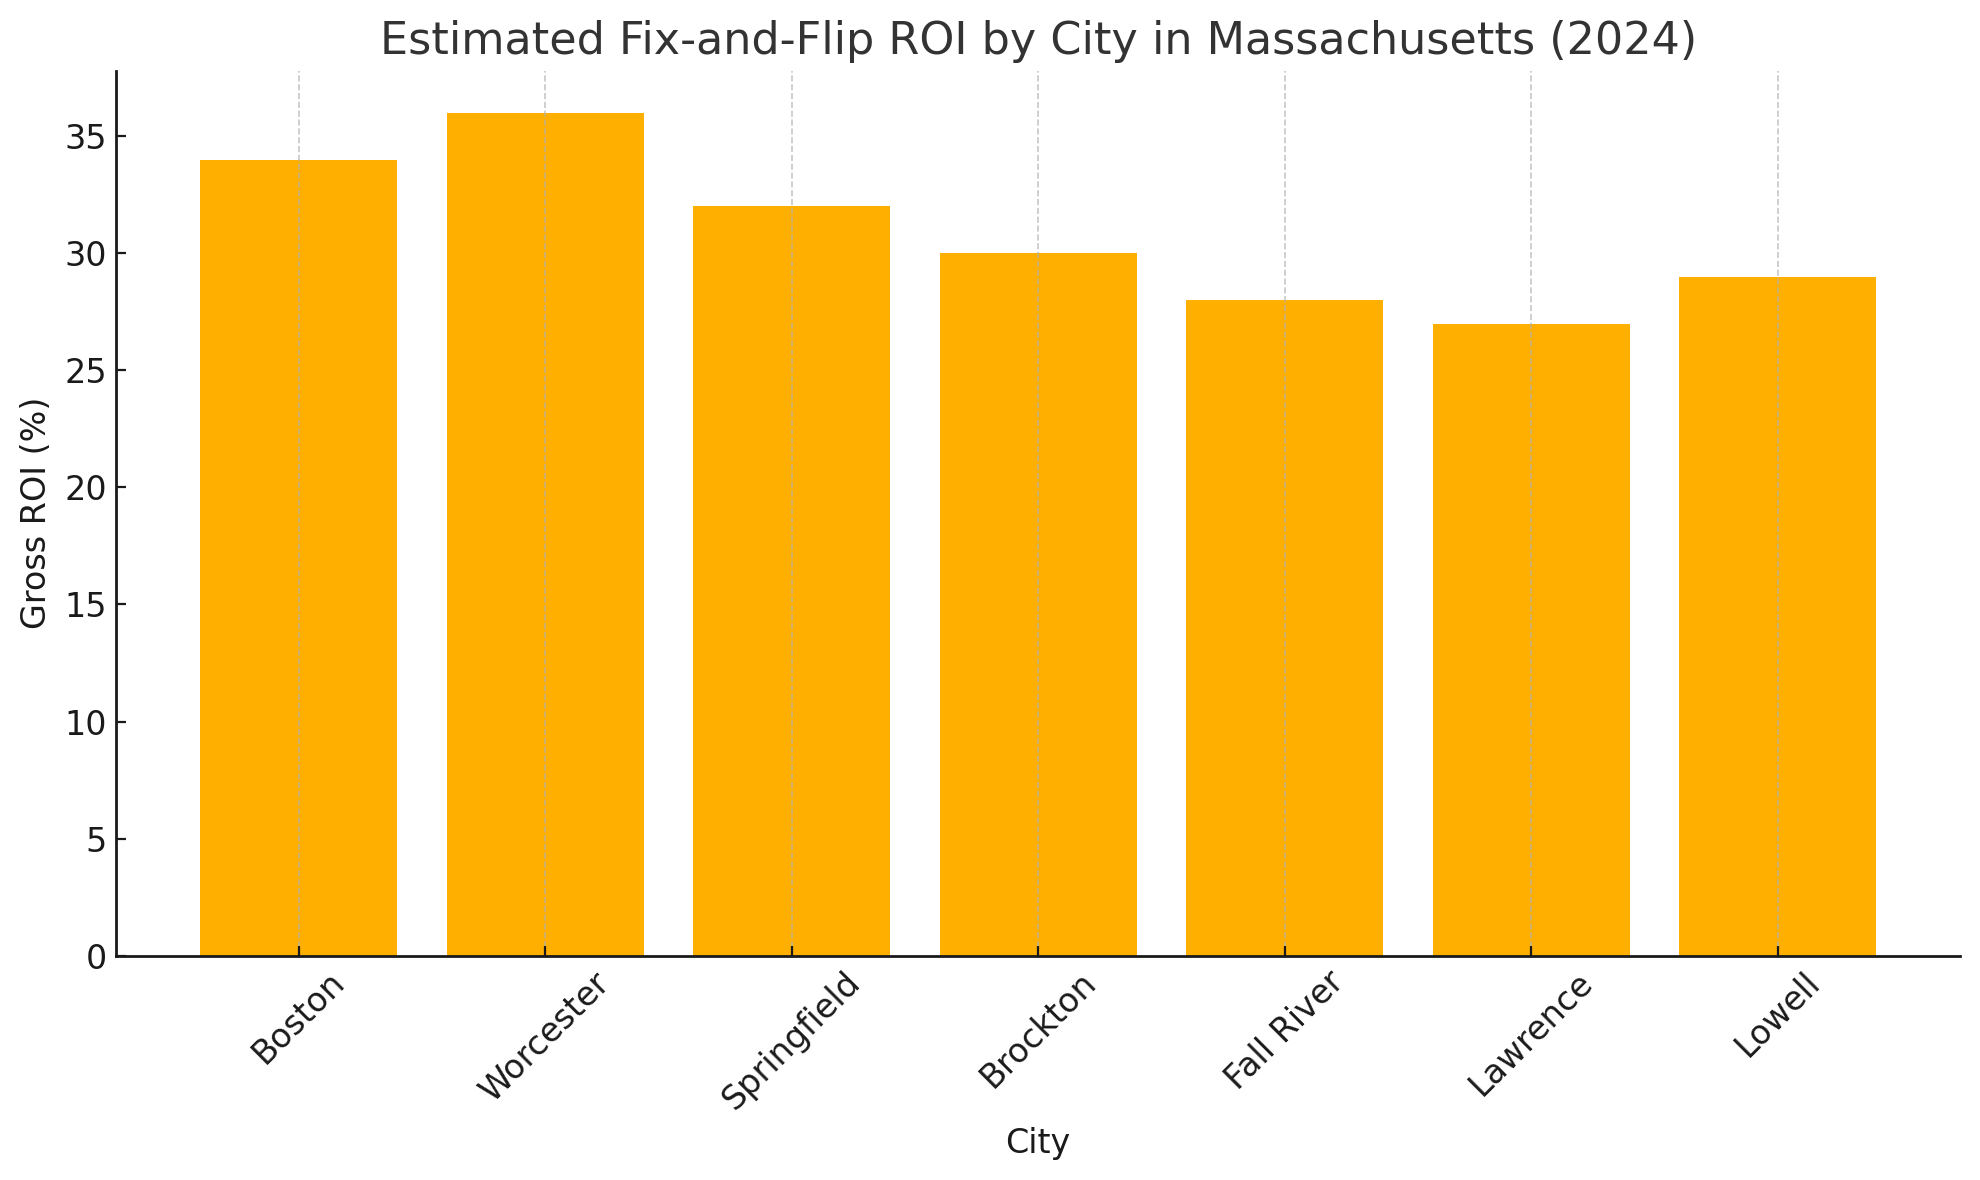
In Q2 2024, the average flip in Massachusetts brought in a gross profit of $142,400—nearly double the national average. That translated to an impressive 38–39% ROI. In Greater Boston, it was even juicier: the median flip profit hit $155,000 in late 2023.
Of course, that’s the gross. Once you subtract Massachusetts-sized rehab costs, long holding periods, and generous property taxes, that net profit starts looking more like a respectable-but-not-exotic vacation. Think Cape Cod in October, not Bali.
Where Are the Flips Happening?
While flipping activity is concentrated in Greater Boston, places like Worcester, Springfield, Brockton, and parts of the South Shore are increasingly popular. These areas offer:
- Lower acquisition prices
- Older housing stock in need of love
- Higher flip-to-value potential
Worcester and Springfield in particular are seeing above-average flipping rates, driven by affordability and surging demand. In 2023, flip rates exceeded 10% of home sales in several Massachusetts counties.
But let’s not sugarcoat it: timelines are stretching. The average Boston-area flip now takes nearly 190 days to complete. That’s a long time to babysit a renovation budget while inflation chews through your contingency fund.
Ground-Up Construction: A Slow Burn
 If fix-and-flip is a sprint, ground-up construction in Massachusetts is a marathon through molasses. The state’s restrictive zoning laws, permit timelines, and strict building codes have long made new construction challenging.
Boston permitted fewer than 1,900 multifamily units in 2023—a dramatic drop from the nearly 4,000 in 2022. And statewide, we’re still hovering around 14,000 total new housing permits per year, when we need at least 20,000 annually to meet demand.
But not all is doom and permit hell. Some regions—like parts of Central and Western Massachusetts—are stepping up. Worcester County, the South Coast, and select South Shore communities are seeing modest growth in single-family construction and small multifamily developments.
And here’s a twist: developers are experimenting with modular construction (like Somerville’s Clarendon Hill project) and using creative zoning workarounds to build more affordably and quickly. There’s hope yet.
Top Markets (and Ones to Watch)
Massachusetts isn’t just one market—it’s a patchwork quilt of micro-economies stitched together with commuter rail lines, craft breweries, and wildly different permitting processes. Here’s a deeper dive into where the smart money is heading, and why.
 Greater Boston: The heavyweight champ, and for good reason. Home to some of the highest property values in the state, Greater Boston continues to see relentless demand, particularly in edge neighborhoods like East Boston, Dorchester, Mattapan, and Revere. These areas combine relatively lower entry points with strong appreciation potential. However, developers here must be ready for stiff competition and drawn-out permitting—think neighborhood meetings where every window trim is a debate topic. Still, flips and modest infill development remain lucrative for the well-prepared.
Worcester: Once overlooked, Worcester has graduated from scrappy underdog to regional star. With a median sale price still well below the state average and growing interest from Boston commuters and remote workers, Worcester offers a rare combo: affordability, demand, and development upside. The city’s planning office is increasingly pro-growth, and inventory turns quickly. Multifamily renovations, triple-decker rehabs, and ADU-friendly zoning in some neighborhoods are giving investors a wider toolkit to work with.
Springfield: This Western Mass standout became a national headline-grabber in 2024 when Realtor.com named it the hottest housing market in the country. That wasn’t just hype—Springfield offers fast-moving inventory, strong rental demand, and entry points that are still under $300K. It’s particularly attractive to first-time homebuyers and Section 8 investors. Caution is warranted when budgeting for flips: the resale ceiling is lower than Boston’s suburbs, so overbuilding is an easy trap.
Gateway Cities: These midsize cities—including Lowell, Lawrence, Brockton, Fall River, and New Bedford—are magnets for flippers and small developers. With historic mill buildings, legacy housing stock, and local governments hungry for revitalization, the opportunity is real. Many are benefiting from MassHousing support and historic tax credit programs that sweeten the math for substantial renovations. Just be prepared to handle older infrastructure, tighter labor pools, and some neighborhood-specific market dynamics.
South Shore: Towns like Quincy, Weymouth, and Braintree are booming as priced-out Boston buyers head south in search of space, affordability, and commuter convenience. The South Shore has seen sustained appreciation and growing appeal for both single-family flips and small-scale new builds. Older Cape-style and ranch homes offer a sweet spot for cosmetic rehabs, while coastal towns further out (like Scituate or Marshfield) remain high-end renovation plays.
Central Massachusetts & MetroWest: Communities like Shrewsbury, Leominster, and Marlborough are becoming increasingly popular among developers looking for growth corridors with decent infrastructure and more reasonable permitting processes. These towns are seeing spillover demand from both Boston and Worcester, especially among buyers seeking balance between price, commute, and quality of life.
In short: the top markets in Massachusetts each come with their own playbook. Whether you’re chasing appreciation, cash flow, or long-term holds, you’ll find a niche. Just remember: in this state, zoning board charm might be as important as a strong pro forma.
Massachusetts vs. The Rest of the U.S.: How Does It Stack Up?
If Florida is the land of endless flips and Texas is the kingdom of sprawl, Massachusetts is the realm of boutique plays with healthy margins. Here’s how we compare:
- Construction Volume: MA lags badly. While states like Texas and North Carolina permit 6–8 homes per 1,000 residents, MA barely cracks 2.5.
- Flip ROI: Surprisingly strong. While many Sunbelt cities saw flipping ROI crash to single digits in 2023–24, Massachusetts investors held steady at 30–40% gross.
- Regulations: Tight. Zoning, permitting, historical commissions, and new energy codes make building tough—but also protect margins by keeping competition low.
- Financing: Private money is readily available for experienced investors. Still, local banks and equity partners are active, and experienced investors rarely struggle to find capital.
- Foreclosures: Rising slowly. Massachusetts had one of the biggest year-over-year jumps in foreclosure starts in 2024, though total volumes remain modest. Foreclosure and REO plays could increase in 2025.
Regulatory Red Tape: Not for the Faint of Heart
Massachusetts’ zoning map sometimes looks like it was drawn by someone who hates multifamily housing. Large lot requirements, height restrictions, and local veto power have long constrained development.
The new MBTA Communities law is a step in the right direction, requiring transit-adjacent towns to zone for more housing, but implementation has been slow and reluctant.
Meanwhile, the state’s latest stretch energy code—requiring EV-ready parking, net-zero design, and solar readiness—is raising construction costs, particularly in progressive municipalities. It’s great for the planet, but rough on pro formas.
Risks & ROI in 2025: Worth the Hassle?
Let’s break it down:
- High rehab costs: Materials and labor are expensive. The trades are stretched thin, and some contractors are booked out for months.
- Delays: Permits, materials, and inspections are all taking longer than expected. Add a snowstorm or two, and your timeline just ballooned.
- Interest rates: Still high. Fed cuts may help, but don’t bank on it.
- Market uncertainty: Prices are high. Will they stay there? Most analysts expect modest growth or flatlining in 2025, but nothing’s guaranteed.
Still, the opportunity is there—especially for savvy investors who:
- Buy below market
- Budget conservatively
- Know how to navigate local politics and permitting
- Have multiple exit strategies
Final Thought: Massachusetts = High Effort, High Reward
Massachusetts isn’t for the lazy investor. The barriers to entry are real—but so are the margins. With tight housing inventory, insatiable demand, and slowly modernizing policies, the fix-and-flip and ground-up construction opportunities here remain strong for those who do their homework.
Whether you’re turning around a neglected triple-decker in Worcester or building sleek infill units in Quincy, the Bay State has plenty to offer. Just bring your patience, your spreadsheets, and maybe a parka.
Ready to dive deeper? Connect with our lending team at AHLend.com for personalized financing strategies, capital to fund your next project, or insights on Massachusetts market opportunities. We’re here to help you build—one property (or spreadsheet) at a time.
Frequently Asked Questions
Is flipping still profitable in Massachusetts in 2025?
Yes, even with high rehab costs and long timelines, Massachusetts remains one of the strongest flipping markets in the country. In 2024, the average flip grossed around $142K statewide and up to $155K in Greater Boston, translating to 38–39% ROI. Margins are solid because demand is high and inventory is extremely tight.
Why is new construction so difficult in Massachusetts?
Massachusetts has some of the strictest zoning laws, longest permitting timelines, and toughest energy codes in the U.S. These factors slow down development and increase costs, especially in cities with active neighborhood boards or historic commissions. While this makes building challenging, it also limits competition and protects long-term margins for developers who navigate the process successfully.
Which Massachusetts markets offer the best opportunities for flippers and small developers?
Worcester, Springfield, Brockton, Lowell, Lawrence, Fall River, New Bedford, and South Shore towns like Quincy and Weymouth all present strong opportunities. These areas combine lower entry prices, older housing stock, and strong demand. Greater Boston edge neighborhoods like East Boston, Dorchester, and Mattapan also offer high potential for investors willing to manage longer permitting and higher project costs.
What are the biggest risks investors face when flipping or building in Massachusetts?
The top risks include high rehab costs, long construction and permitting delays, elevated interest rates, and ongoing regulatory hurdles such as strict energy codes and zoning limitations. Investors also need to avoid overbuilding in lower-priced markets and budget conservatively since timelines in Massachusetts often stretch beyond initial expectations.
Sources
-
Massachusetts Association of Realtors – for statewide median home price and permitting data.
-
U.S. Census Bureau – for new residential construction permit rates by state and metro area.
-
Realtor.com – for housing market heat rankings, including Springfield’s 2024 top ranking.
-
ATTOM Data Solutions / RealtyTrac – for house flipping rates, ROI, and foreclosure statistics.
-
CoreLogic – for national and regional home price appreciation trends.
-
Greater Boston Housing Report Card – for multifamily permitting trends and development policy analysis.
-
MassHousing and MassWorks – for incentives, grants, and tax credit availability in Gateway Cities.
-
MBTA Communities Law documentation – for zoning reform requirements and town-level compliance.
-
Massachusetts Department of Energy Resources – for updates on the stretch and specialized stretch energy codes.
-
Local city permitting departments (e.g., Boston, Worcester, Somerville) – for permit issuance data and regulatory timelines.
-
Bankrate and Freddie Mac – for national mortgage and construction loan rate context.