Ever taken one look at a dated bungalow in Denver and thought, “This place has good bones… and maybe a few skeletons in the closet”? Colorado house flipping blends the thrill of uncovering hidden potential with the occasional plumbing surprise—and yes, sometimes both at once. Expect a whirlwind tour through historic boom cycles, neighborhood-by-neighborhood breakdowns, and the nitty-gritty of zoning laws that can stall a project for months. From the sun-drenched terraces of Pueblo to the snow-dusted rooftops of Boulder, this guide illuminates the trends, traps, and tactical plays that keep profit margins healthy and hard hats in place. Whether plotting a quick cosmetic facelift or diving into a full gut rehab, the strategy snapshots and real-world takeaways here will serve as a trusty compass for navigating Colorado’s fix and flip frontier in 2025.
A Quick Trip Down Memory Lane (2015–2023)
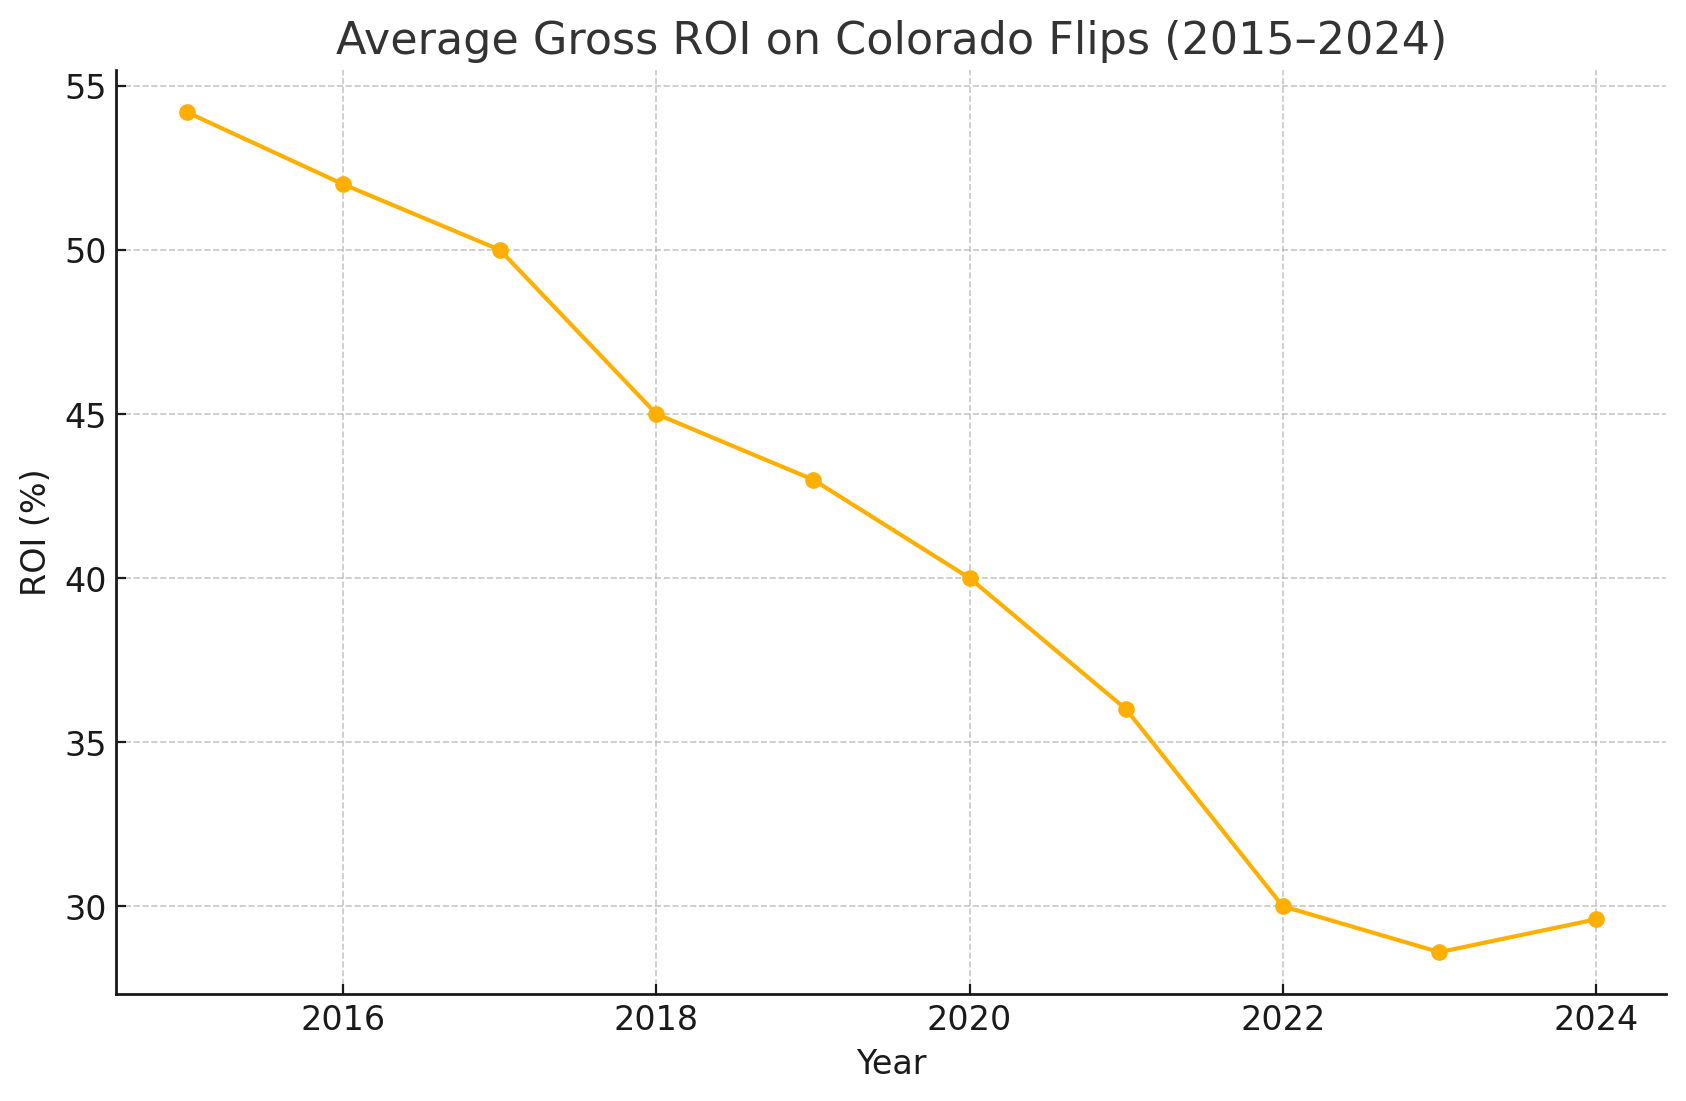
Travel back to the mid-2010s, when Colorado’s flip game resembled a treasure hunt on every block:
- Mid-2010s Boom (2015–2017): After the foreclosure glut from the Great Recession finally dried up, investors swooped in on bargain properties. Tech giants and startups set up shop in Denver and Boulder, drawing an influx of employees. Median home prices rose ~6% annually but still left ample room to buy, renovate, and sell—often yielding gross ROIs north of 50% on kitchen-and-bath turbo-charges. In neighborhoods like Capitol Hill or Five Points, a $300K buy could flip for $450K post-reno, with weeks spent hunting materials, not buyers.
 Urban Revitalization & Rising Demand (2018–2019): Light rail expansions (West Rail Line into DTC, A Line to DIA) and major mixed-use projects (Union Station redevelopment) fueled excitement. Flippers capitalized on formerly overlooked areas—Globeville’s warehouses became loft-style homes, and Highland’s Victorian stock got modern makeovers. Appreciation accelerated to ~7% YoY, and flip volume climbed steadily, comprising 8–9% of Metro Denver sales.
- Pandemic-Era Frenzy (2020–2022): Lockdowns and low interest rates created a zero-sum game for buyers. Inventory plunged, competition soared, and flipped homes accounted for 10% of U.S. transactions, with Denver approaching 15%. Cash offers dominated, and “As-Is” listings commanded full price. Flip windows shrank to days—some properties never even hit the MLS before going under contract.
- Correction & Compression (2022–2023): As mortgage rates climbed from under 3% to above 6%, buyers retrenched. Flip volumes tumbled 30% nationwide, and Denver’s average ROI dropped to 27.5%. Carrying costs—higher financing expenses, insurance hikes, and extended holding times—ate into margins. Some flippers pivoted to rentals, while others tightened budgets and added stricter contingencies.
Lessons Learned:
- Early entrants rode a perfect storm of cheap capital, scarce inventory, and rising rents.
- Infrastructure investments and urban infill projects can create new flip corridors almost overnight.
- Margin stress compounds quickly when macro factors shift—forecast financing and holding costs conservatively.
- Flexibility (switching between flip and rental playbooks) can rescue projects during downturns.
Current Market Pulse (2024–2025)
Even as national flip volumes took a breather, Colorado’s market shows surprising resilience—thanks to demographic tailwinds, economic diversity, and persistent supply constraints. Key forces shaping the landscape today include:
- Population Influx Continues: More than 130,000 new residents arrived between 2021 and 2024, sustaining demand for updated homes even as other states cool off.
- Robust Job Base: Tech firms expanding in Boulder–Longmont, aerospace growth along the Front Range, and new energy projects around Greeley have kept employment strong and buyers active.
- Supply Bottlenecks: Geographic limits (mountains and open space mandates) and slow permit backlogs curb new builds, funneling more buyers into the resale and flip markets.
- Rising Borrowing Costs: With benchmark mortgage rates hovering near 6.5%, flip financing is pricier, encouraging more cash or private-equity deals but also limiting overly speculative plays.
| Metric | Value | Year-over-Year Change | Context & Impact |
|---|---|---|---|
| Median Sale Price | ~$625,000 | +1–2% | Steady appreciation keeps ARVs healthy but limits bargain buys. |
| House Flips as % of Sales | ~7.8% | -0.2% | Slight dip from 2023’s frenzy—signals stabilization, not collapse. |
| Average Gross Profit | $72,000 | +5.9% | Improved efficiency and selective buying have nudged profits upward. |
| Average ROI | 29.6% | +1% | Narrow but positive rebound—margins remain thinner than mid‑2010s highs. |
| Days on Market (Statewide) | 31 days | +5 days | Listings sit longer—pricing precision and staging now more critical. |
| Days on Market (Denver MSA) | 38 days | +7 days | Metro competition intensifies; suburban flips often sell faster. |
| Active Listings | ~9,500 homes | +27% | More inventory provides choice but also requires sharper pricing. |
| Permit Approval Lead Time | 150–385 days | +30 days | Variable by city—cosmetic rehabs still fastest route to market. |
| Hard Money Rates | 10–12% | +1–1.5% | Carried costs are higher—quick flips and cash equity partnerships prevail. |
Regional DOM & Pricing Nuances
- Denver Metro: At 38 days, buyers still move fast on turnkey homes but balk at over‑improved flips.
- Colorado Springs & Aurora: Flips average 30–35 DOM—military transfers and commuter demand keep traffic brisk.
- Fort Collins: 32 DOM; student rentals sometimes convert to mid‑week open houses for accelerated sales.
- Pueblo: 25 DOM; limited competition means well-priced, updated homes often get multiple offers.
Seasonal & Tactical Considerations
- Winter Work, Spring List: Use colder months (November–February) for detailed interior scopes—finishes, fixtures, and that trendy shiplap wall. Schedule exterior bids for March–April to avoid snow delays.
- Market Windows: Early Q2 (April–May) remains peak selling; late Q3 (September) offers a smaller bump as families settle before school.
- Pricing Strategy: In a rising-inventory environment, price just below comp averages to generate bidding momentum, then use buyer urgency to the flip’s advantage.
Overall, the 2024–2025 pulse suggests a maturing flip market: less frenetic than the pandemic years, but far from cooled off. Success hinges on blending data-driven decision‑making with nimble timing and local market savvy.
Hot Colorado Fix And Flip Markets: Where the Numbers Line Up
Not every zip code is created equal. The table below highlights five markets where flips have shown strong, sustainable returns for 2024–2025:
| Market | Median Sale Price | Average Rent | ARV vs. Purchase Gap | Why It Works |
| Denver MSA | $618,000 | $1,691 | ~$75,000 | Diverse economy, resilient demand, big-ticket profits. |
| Colorado Springs | $470,000 | $1,313 | ~$136,000 | Military presence, tech spillover, strong value-add. |
| Aurora (Denver Suburb) | $490,000 | $1,495 | ~$111,000 | Affordability, growing population, commuter demand. |
| Fort Collins | $551,000 | $1,586 | ~$60,000 | College town rentals, stable flips, manageable permits. |
| Pueblo | $277,000 | $945 | ~$50,000 | Low entry cost, rising buyer interest, low competition. |
Denver MSA:
The epicenter of Colorado’s flip universe. With a median sale price of $618K, typical renovation budgets land between $65K–$70K, and post‑renovation ARVs frequently exceed $700K.
Key Metrics:
- Average Gross Profit: ~$75K (28% ROI pre‑costs)
- 12‑Month Appreciation: ~3.4% increase in median prices
- Days on Market: ~38 days for turnkey flips
- Permit Backlog: 150–385 days for major scopes; cosmetic projects 30–60 days
- Investor Competition: 10–15 bids on well‑priced properties
Market Nuance:
Denver’s flip opportunities hinge on hyperlocal trends—what’s hot in Globeville might be passé in Highlands. Transit expansions (e.g., the N Line to Thornton) are driving demand in formerly overlooked corridors, creating new hotspots for affordable flips. Buyers here range from young professionals seeking modern lofts to downsizing retirees craving maintenance‑free living, so tailoring finishes—industrial‑chic in River North (RiNo) or craftsman‑style in Berkeley—can command premium ARVs. High‑rise condo conversions and micro‑units near Ballpark District require navigating HOA regulations, yet yield outsized returns for investors who master those playbooks.
Colorado Springs:
Value‑driven flips thrive against the backdrop of military and tech growth. The median sale price is $470K, with ARVs in neighborhoods like Old Colorado City and Broadmoor Hills often hitting $610K+.
Key Metrics:
- Average Gross Profit: ~$75K (30% ROI)
- 12‑Month Appreciation: ~2.8%
- Days on Market: ~32 days
- Permit Timelines: 60–120 days, even for structural work
- Local Labor Costs: ~10% below Denver
Market Nuance:
The influx of Fort Carson soldiers and civilian contractors supports steady demand, particularly for mid‑range three‑bedroom homes. Flips in east‑side subdivisions (Rockrimmon, Briargate) command higher buyer interest, as do projects near Peterson AFB promising quick resale to incoming officers. Seasonal weather swings moderate outdoor work windows, so savvy investors schedule exterior paint and landscaping for late spring. While rapid new‑home developments in northern corridors can undercut flip supply, focusing on established neighborhoods with mature trees and community amenities (playgrounds, bike trails) yields stronger buyer appeal. Soft finishes—neutral palettes and built‑in smart home systems—resonate with both military leases and civilian purchasers.
Aurora:
A dynamic Denver suburb with an ethnic tapestry and booming redevelopment. The median price is $490K, and ARVs near $600K post‑rehab.
Key Metrics:
- Typical Rehab Cost: $60K
- Average Gross Profit: ~$70K (29% ROI)
- 12‑Month Appreciation: ~3.1%
- Days on Market: ~34 days
- Permit Approval: 90–180 days
Market Nuance:
Aurora’s proximity to Denver International Airport and Anschutz Medical Campus fuels demand for both starter homes and executive rentals. Neighborhoods such as North Aurora and Montclair combine mid‑century ranch bones with lots that allow accessory dwelling units (ADUs), making basement conversions especially profitable. Cultural diversity means multi‑unit configurations and open‑concept kitchens appeal widely. Investors also watch the Cherry Creek School District boundary shifts—properties within coveted schools can fetch a sweet premium. Community investment projects (e.g., Lowry redevelopment) have transformed old military bases into mixed‑use hubs, and flips in these areas benefit from new retail and green‑space amenities.
Fort Collins:
The college town vibe (CSU) blends with tech and craft brewery culture. Median sales at $551K, and ARVs around $610K.
Key Metrics:
- Rehab Budgets: ~$50K
- Gross Profit: ~$55K (25% ROI)
- 12‑Month Appreciation: ~3.6%
- Days on Market: ~32 days
- Permit Efficiency: 45–90 days
Market Nuance:
Flips timed around university calendars capture waves of student‑parent buyers in early summer and returning graduates in late spring. Historic districts (Old Town) favor preservation‑sensitive rehabs—exposed brick restorations and period‑correct millwork can significantly boost ARVs. The booming craft beer scene has drawn millennial professionals seeking walk‑to‑bar lifestyles, making small downtown loft flips surprisingly lucrative. Zoning overlays encourage mixed‑use opportunities, where a street‑level café below a renovated apartment can uplift the building’s total value. Local green‑building incentives (solar reimbursement, energy audits) also tip buyer interest toward eco‑friendly upgrades.
Pueblo:
The underdog market where affordability meets renaissance. Median sales hover at $277K, with ARVs of $350K–$375K after upgrades.
Key Metrics:
- Average Gross Profit: ~$28K (20% ROI), often 25–30%
- 12‑Month Appreciation: ~4% (among highest by percentage)
- Days on Market: ~25 days
- Permit Turnaround: 30–60 days
Market Nuance:
Pueblo’s historic neighborhoods (Belmont, Grandview) feature brick bungalows ripe for kitchen and bath overhauls that resonate with buyers seeking affordable charm. The city’s revitalization grants and tax‑credit programs for heritage properties can offset rehab costs, turning sub‑$200K buys into $300K+ ARVs. A growing craft-distilling scene and arts district create lifestyle appeal, drawing millennials priced out of Denver. As local investor activity grew 15% in 2024, competition is still light enough to find deals at moderate discounts. Light commercial conversions—turning old storefronts into loft‑style homes—have become a novel niche, exemplifying Pueblo’s creative revival spirit.
Beware the Pitfalls: Markets That Bite Back
Some locales can turn a promising deal into a wallet-draining ordeal. Here’s a deeper dive into the quirkiest—and most treacherous—corners of Colorado’s fix-and-flip world:
Boulder & Resort Towns
Boulder’s median sale price sits north of $1 million, and its strict design review boards, historic preservation overlays, and green building mandates can quadruple permit fees and add 6–12 months to timelines. Resort markets such as Aspen and Vail face similar hurdles: ultra-premium acquisitions (median >$2 million), tiny buyer pools, and a contractor shortage that tacks on 15–20% travel and premium fees. Holding costs—taxes, insurance, and winterizing expenses—can exceed $10 K per month, turning a slight delay into a profit-killer.
- Key Traps: Mandatory solar-ready infrastructure, community hearings for façade changes, and local HOA reviews; virtually no distressed inventory
- Market Impact: Projects often yield <10% ROI, making only highly seasoned investors with deep pockets thrive here
Greeley
Once an affordable stepping-stone, Greeley has seen average flip ROIs evaporate to around 6.4% in 2024. A flood of speculative new builds and a cooling oil-and-gas sector have suppressed resale values. Acquisitions under ARV minus rehab costs are increasingly rare, and flippers who overpay find themselves in tight squeezes.
- Key Traps: Rapid build-out in newer subdivisions can saturate entry-level segments; economic ties to the oil industry introduce cyclical risk
- Time on Market: ~45 days (versus 31 days statewide), forcing extended carrying costs
- ROI Reality: Expect single-digit returns (5–8%) unless securing off-market deals at deep discounts
Remote Mountain & Rural Areas
Places like Leadville or Meeker enchant with scenic vistas, but sparse buyer pools turn flips into endurance tests. Contractors impose travel surcharges, and materials shipments can double standard lead times. A project dragging into snow season not only spikes holding costs but often requires emergency weatherproofing repairs.
- Key Traps: Seasonal construction windows (May–October), high per-diem charges for crews, limited subcontractor options
- Permit Insights: County permits may process in 30–90 days but lack digital tracking—leaving timelines unpredictable
- Risk‑Adjusted ROI: Wide variability (10–25%), but net returns typically fall below urban markets after factoring in risk and delays
Though daunting, these challenging markets can yield outsized gains for specialists who:
- Cultivate deep relationships with niche contractors willing to travel or work off-season
- Master hyperlocal regulations (e.g., historic district guidelines in Boulder)
- Source off-market or wholesale deals to offset high entry costs
Proceed with caution—and always maintain a generous budget buffer when tackling Colorado’s trickiest flip territories.
The 5 Golden Rules of Colorado Flipping of Colorado Flipping
1. Crunch the Numbers Like There’s No Tomorrow
- Apply the 70% Rule: Pay ≤70% of ARV minus rehab costs. This old chestnut still protects margins.
- Embed Contingencies: Add 10–15% extra for surprises—foundation issues, hidden mold, or that generator room you didn’t know you needed.
- Target Net Profits ≥$50K: Below that, the risk–reward ratio sours; above that, the flipping road is a bit smoother.
2. Become a Permit Whisperer
- Expect Long Lead Times: Denver’s major project permits can take up to 385 days—so strategize accordingly.
- Cosmetic-Only Projects: If permits scare you, focus on painting, flooring, cabinetry, and fixtures—often permit-free or faster to approve.
- Local Nuances Matter: In Lakewood, historic-district overlays can derail quick flips, while Thornton may breeze through permits in 60–90 days.
3. Master the Money Puzzle
Financing flips in Colorado demands both speed and reliability. Institutional hard money and private money lenders now lead the pack by offering the best of both worlds: lightning-fast closings, high leverage, and transparent terms backed by professional standards.
- Institutional Hard Money Loans: These products cover up to 90% of purchase price and rehab costs, with all-in rates typically around 9–11%—slightly below small private lenders. Institutions use streamlined underwriting and draw-based advances, enabling flips to close in 10–14 days with clear renovation reserves and no hidden fees.
- Private Money & Equity Partnerships: Offer tailored deal structures—interest-only payments, built-in reserves, and flexible prepayment terms. These lenders leverage local market expertise and relationship-driven underwriting, often matching institutional rate tiers for active borrowers.
- Hybrid Financing Solutions: The newest offerings blend hard and private money features: draw schedules for rehab, interest-only periods, and optional conversion to permanent rental financing or DSCR loans post-flip. This flexibility means investors can plan exits confidently without scrambling for follow-on capital.
- Speed vs. Cost Trade-Off: Cash deals close in 1–2 days but lock up capital. Traditional banks are slow and restrictive. Institutional hard money bridges the gap—10–14 day closings, competitive all-in costs, robust reporting, and compliance safeguards.
- Exit Strategy Integration: Institutional lenders often provide clear waterfall models and exit-analysis tools, helping investors project net returns accurately. Many also offer permanent refinance options, so a rental hold or BRRRR strategy is just a loan conversion away.
By prioritizing institutional hard money and private money solutions, fix-and-flip investors balance rapid deal execution with cost-effectiveness and professional reliability—positioning these capital sources as the go-to choice in Colorado’s competitive flip market.
4. Lock Down Your A-Team
- Contractor Relationships: In a landscape where 70% of contractors report labor shortages, a reliable crew is like gold. Keep them busy and happy.
- Scope Surfing: Favor high-impact, labor-light tasks when timelines tighten—think accent walls, open shelving installations, or light plumbing reroutes.
- Quality Over Quantity: A few late nights of supervising tile cuts is better than a half-baked bathroom redo that scares off buyers.
5. Time the Market Like a Pro
- Spring Launch Window: Finish renovations by late winter to hit the market in March–April when buyer demand peaks.
- Avoid Holiday Lulls: Listings in late November or December risk being lost in the mix—unless priced to move fast.
- Monitor Local Signals: Track months of inventory and DOM; if they trend upward, price competitively rather than holding out.
Advanced Tactics & Pro Tips
- Neighborhood Granularity: Drill down beyond city-level data. A flip in Denver’s RiNo district behaves differently than one in Lakewood’s Edgewater.
- Micro-Markets & Micro-Flips: Sometimes, a quick bathroom and kitchen refresh on a rental property (house hacking) can yield faster returns with less risk.
- Energy Efficiency Sells: Colorado buyers love sustainable features—think new windows, LED lighting, and efficient HVAC systems. They fetch higher appraisals and faster sales.
- Tech-Driven Deal Flow: Use predictive analytics tools (Roofstock, PropStream) to spot off-market deals based on distress signals like code violations or extended vacancy.
- Community Engagement: Host open houses with local flair—free coffee from a nearby roaster, houseplants by Denver’s favorite nursery—to generate buzz and word-of-mouth.
Wrapping Up: From Flips to Fortune
Colorado’s fix and lip scene in 2025 isn’t a lottery—it’s a calculated game of skill, timing, and relationships. By combining data-driven deal analysis, permit mastery, creative financing, trusted teams, and seasonal savvy, profitable flips are more than possible; they’re practically inevitable for those willing to prepare.
From Denver’s high-stakes core to Pueblo’s budget-friendly outliers, the Rockies offer a spectrum of opportunities. Approach each project like a professional: respect local complexities, safeguard margins, and keep exit options open. The rewards are substantial—updated homes that enrich communities and the healthy returns that power serious investing.
American Heritage Lending provides tailored fix-and-flip loans, deep market insights, and dedicated support to keep Colorado’s flips rolling. Here’s to the next wave of transformed homes—and the success stories they generate. Happy flipping, Colorado!
Frequently Asked Questions
Why is Colorado still attractive for fix and flip investors in 2025?
Colorado is still a solid fixing-and-flipping market because demand hasn’t gone away, even though the frenzy cooled off. The state added over 130,000 residents between 2021 and 2024, median sale prices are holding around ~$625,000 with slight appreciation, and the average gross profit is about $72,000 with ROI close to 30%.
Tight housing supply (slow new construction, permit bottlenecks, and geographic limits) keeps buyers focused on updated resale homes, so well-bought and well-managed flips still pencil, just not in a “throw a dart and win” way like during the pandemic.
Which Colorado markets offer the best opportunities for profitable fix and flips?
Several Front Range and secondary markets line up really well for flips:
-
Denver MSA – The main flip hub, with median prices around ~$618K and ARVs often above $700K after renovation, producing big-ticket profits when you buy right.
-
Colorado Springs – Strong military and tech presence, ARV spreads often above $100K, and days on market in the low 30s.
-
Aurora – More affordable than Denver proper, strong commuter and medical employment demand, and good ARV gaps post-rehab.
-
Fort Collins – College town stability (CSU), tech and brewery jobs, manageable rehab budgets, and steady demand.
-
Pueblo – Low entry prices, rising interest, and some of the fastest days on market, great for investors wanting lower competition and respectable ROI.
What are the biggest risks and pitfalls when flipping houses in Colorado?
The big pain points in Colorado flipping are:
-
Long permit timelines (especially in Denver and stricter municipalities), which can stretch projects by months if you take on heavy structural or add-on work.
-
High holding costs in expensive or premium areas (Boulder, resort towns like Aspen/Vail), where taxes, insurance, and carrying expenses stack up quickly.
-
Risky or compressed-ROI markets, like:
-
Boulder & resort towns → super high buy-in, strict design/green rules, small buyer pool, often sub-10% ROI.
-
Greeley → new build competition + cooling oil/gas sector = compressed flip margins.
-
Remote mountain/rural zones → thin buyer pools, travel surcharges for contractors, weather delays.
-
If you underestimate these or skip extra contingency in your budget/timeline, your profit gets eaten fast.
How are most Colorado fix and flip investors funding their projects today?
Most active Colorado flippers are using institutional hard money and private money, not traditional banks.
Common patterns:
-
Institutional hard money lenders
-
Fast closings (about 10–14 days)
-
High leverage on purchase + rehab
-
Interest-only payments and draw schedules for construction
-
-
Private money & equity partners
-
Flexible structures and relationship-based terms
-
-
Hybrid products
-
Rehab funding up front
-
Options to roll into DSCR or rental loans if you decide to hold instead of sell
-
Cash is still king for speed, but tying up all your own capital slows scaling. So in Colorado’s competitive, time-sensitive market, institutional hard money + private money is the main combo for investors doing flips consistently.
Sources
- ATTOM Data Solutions, U.S. Home Flipping Reports (2023–2024)
- Colorado Association of REALTORS® Market Reports (2024–2025)
- Redfin Housing Data, Median Sale Prices & Days on Market (2025)
- Local Government Permitting Data: City of Denver, Aurora, Colorado Springs (2024)
- National Association of Realtors (NAR), Flip Volume & ROI Statistics (2022–2023)
- U.S. Census Bureau Population Estimates (2021–2024)
- Industry Surveys: ColoradoBiz Construction Labor Shortage Reports (2024)
- Local Media: The Colorado Sun (Growth Cap Legislation), Rocky Mountain Voice (Permit Delays)
- PropStream & Roofstock Predictive Analytics Resources
- American Heritage Lending Internal Market Analyses (2025)