Over the past five years, the real estate landscape has evolved at a breakneck pace. Our team has been knee deep in deals for years, and I can say with confidence: we’re no longer operating in the same environment we were in 2019. The game has changed—interest rates have surged, buyer psychology has shifted, institutional capital has flooded the space, and local regulations are transforming faster than ever.
Today, whether you’re flipping a distressed duplex, building a fourplex on an infill lot, managing value-add renovations, or holding a portfolio of rentals in the Midwest, the fundamentals demand sharper analysis, deeper discipline, and a fresh playbook. Capital is more expensive, margins are tighter, and tenant expectations are rising. Add to that a complex macroeconomic backdrop and you’ve got a market that rewards strategic precision more than ever before.
This article is your comprehensive guide to the current and medium-term trends shaping the 1-4 unit property market across the United States. Backed by hard data, boots-on-the-ground insight, and policy context, we’ll unpack what’s working, what’s not, and where the real opportunities lie—from cash-flowing rental markets to overlooked development pockets to rehab strategies that still pencil.
The Macro Picture: Demand Is Durable, But the Game Has Changed
There’s one thing we can still bank on: the U.S. has a deep and persistent housing shortage. We’re millions of units short nationwide, and the pipeline for new housing is constrained by cost, zoning, and labor bottlenecks. Demand hasn’t disappeared—it’s simply evolving. The spike in mortgage rates over the past two years pushed many would-be buyers to the sidelines, extending their time as renters and creating a surge in demand for quality rental housing.
Meanwhile, millions of existing homeowners are locked into sub-3% mortgage rates, making them reluctant to sell and further choking inventory. The result? An unusually stagnant resale market paired with above-average rent demand—a dynamic that’s created both friction and opportunity in the 1-4 unit segment.
Investors now represent about 1 in 6 home purchases across the U.S. Cash buyers dominate, many of them private equity-backed or experienced operators. They’re less rate-sensitive, more opportunistic, and increasingly targeting high-yielding markets. But here’s the catch: returns aren’t what they used to be. Acquisition prices are still elevated, construction and holding costs have ballooned, and rent growth is normalizing. To thrive today, you need to operate with surgical precision—identifying value in local submarkets, optimizing financing, and hedging for downside risk.
Rental Strategy: The Return of Yield (in the Right Markets)
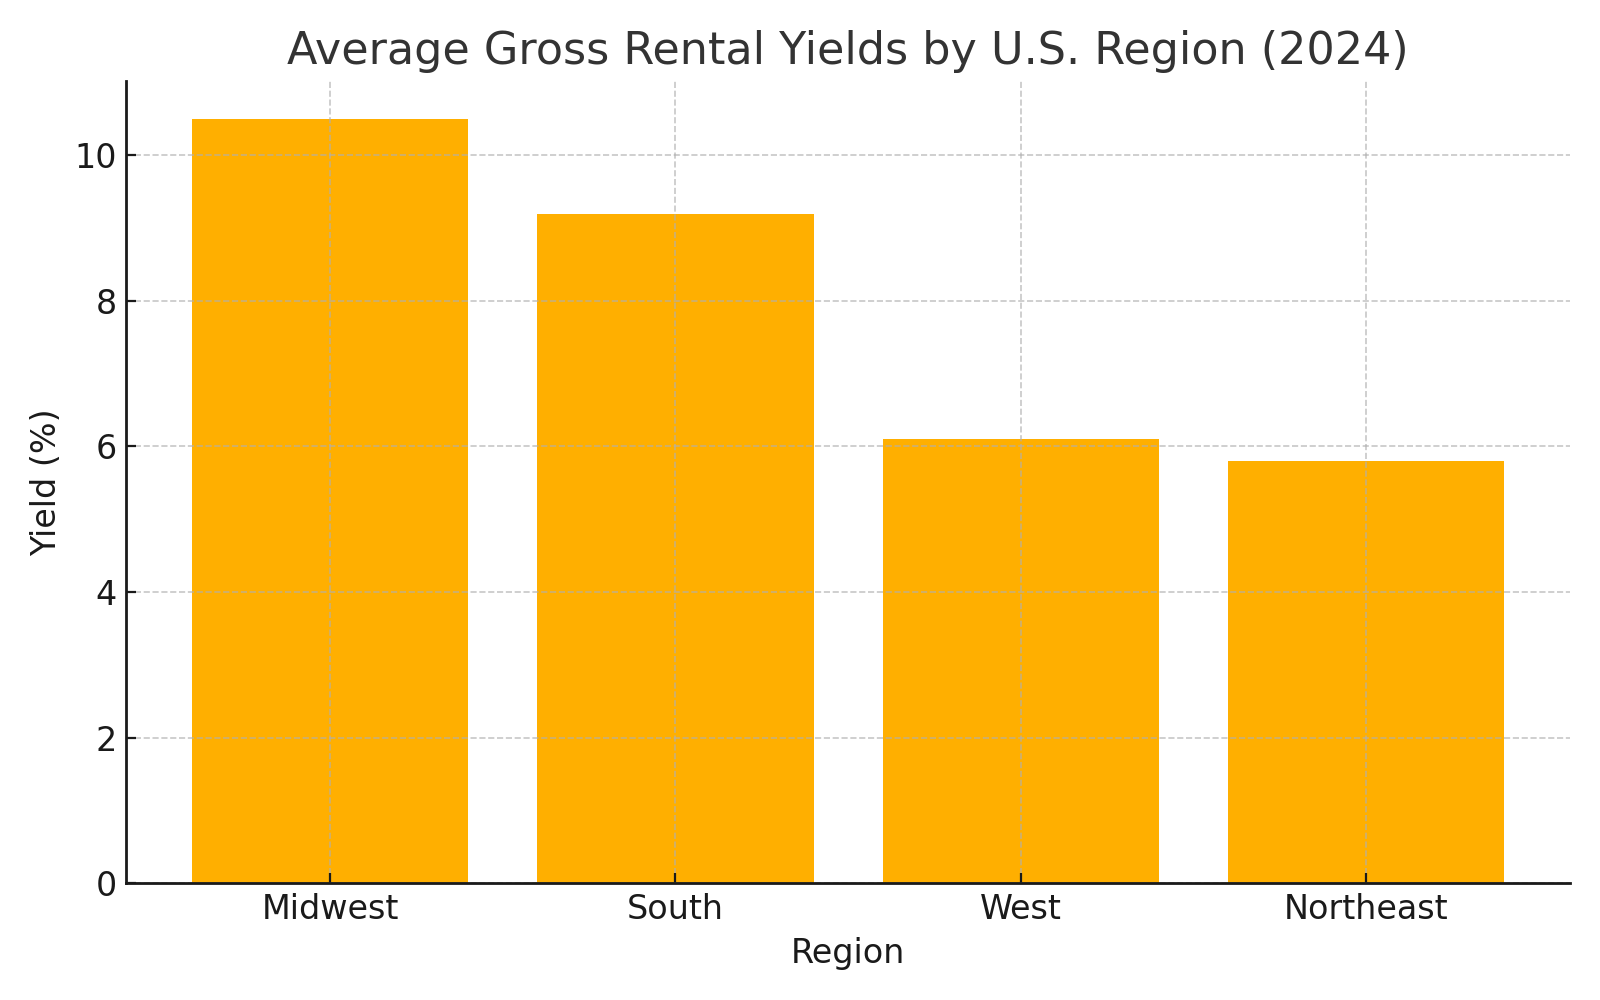 Let’s talk rental income. Gross rental yields ticked up in 2023 for the first time in years. Why? Because while home price appreciation cooled, rent growth held strong, especially in markets with sustained in-migration and limited housing supply. According to ATTOM, the average gross yield on a 3-bedroom home rose to 7.5% nationally, with more than 90% of U.S. counties seeing rent growth outpace property values.
This shift has reopened the door for cash-flow-oriented investors—particularly those buying with little or no leverage. The 2020–2021 bull run compressed yields across the board. Now, as home price appreciation slows and mortgage rates price out owner-occupants, long-term rental strategies are gaining momentum again.
Where are the best opportunities? Look South and Midwest. Markets like Indian River County, FL and Wayne County, MI (Detroit) posted yields between 13% and 15%. These markets not only cash flow better, but they come with lower acquisition costs, minimal competition from institutional buyers, and healthy tenant demand.
That said, rent growth is normalizing. The days of 20% year-over-year hikes are gone. In most metros, 3-4% annual rent increases are now the norm—and in some oversupplied multifamily markets, rents are flat or even declining. Smart investors are underwriting conservatively, hedging for flat rents in year one and stress-testing interest rate scenarios. It’s not about riding the wave—it’s about building for resilience.
Also, keep a close eye on the regulatory environment. Cities like New York and San Diego have passed strict short-term rental ordinances, effectively wiping out Airbnb income for thousands of investors. Some are pivoting to medium-term or long-term rental models. In other places, statewide rent control caps (think Oregon or California) are changing the math for BRRRR investors.
Bottom line: rental properties still offer strong risk-adjusted returns—especially in affordable metros—but investors need to factor in operating expenses, regulatory friction, and tenant expectations for renovated, energy-efficient units.
Flipping Strategy: Margins Are Tight, but Skill Still Pays
Flipping remains a viable strategy in 2025, but success hinges on precision and adaptability. Recent data indicates that while average gross profits have seen a slight uptick, the return on investment (ROI) has experienced a modest decline.
- Average Gross Profit: As of Q3 2024, the average gross profit for house flipping was approximately $70,250, reflecting a 28.7% ROI.
- Average ROI: The ROI on median-priced home flips nationwide has dropped 16 percentage points since 2020 and is off by 25 points from the decade-high seen in 2016.
- Average Time to Flip: The average time from purchase to resale increased slightly from 164 days in Q1 2024 to 166 days in Q2.
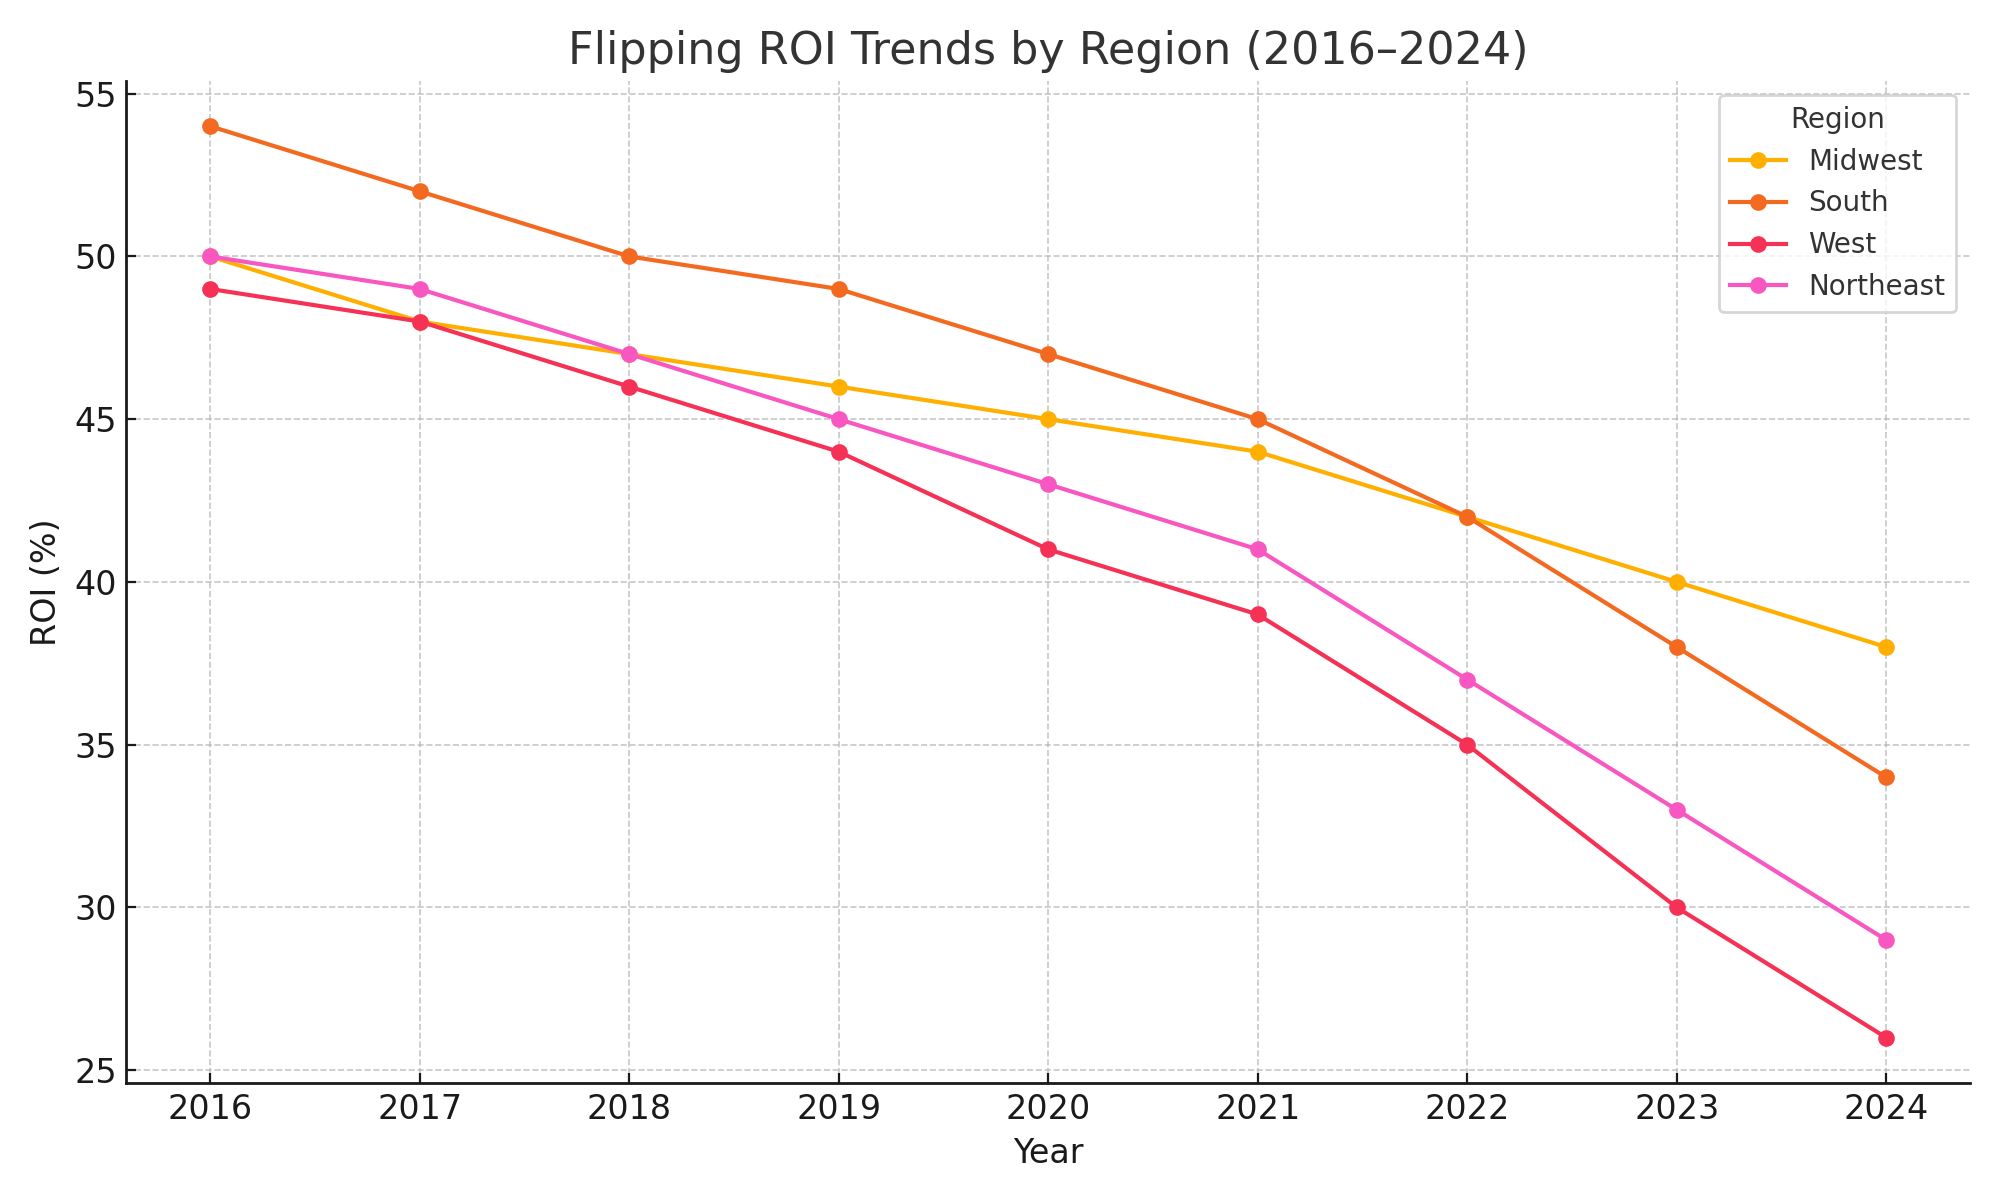 Regional disparities are significant. In 2024, Pennsylvania generated the largest ROI at 80.2%, while flippers in markets like Austin, TX, saw profits as low as $8,844. That’s a stark illustration of how localized flipping success has become.
In today’s market, discipline is everything. The days of buying anything with good bones and selling it at a premium six weeks later are over. Now, you have to execute high-quality rehabs, stick to budget, and price your exit right.
Certain markets still offer strong returns. Cities with low acquisition prices and strong end-user demand—such as Buffalo, Pittsburgh, and Baltimore—continue to post above-average flip ROIs. These markets benefit from older housing stock, steady demand, and limited competition from institutional players.
Meanwhile, flippers in overheated metros like Dallas, Phoenix, and Salt Lake City have seen profit margins erode. Inventory build-up and rate-sensitive buyers have led to longer days on market and reduced final sale prices. In these metros, execution and pricing strategy make or break a deal.
The good news? iBuyers have largely exited the arena. With Zillow Offers gone and Opendoor scaling back, local investors once again have a seat at the table. But expectations need to adjust. Budget for at least 6–7 months hold time, build contingency into your construction budget, and avoid over-improving for the neighborhood.
Consider exit flexibility as a must. If the flip doesn’t sell, can you rent it? Can you refinance it? Having a viable Plan B can mean the difference between a win and a write-off.
Construction and Infill Development: Small-Scale Is the Next Frontier
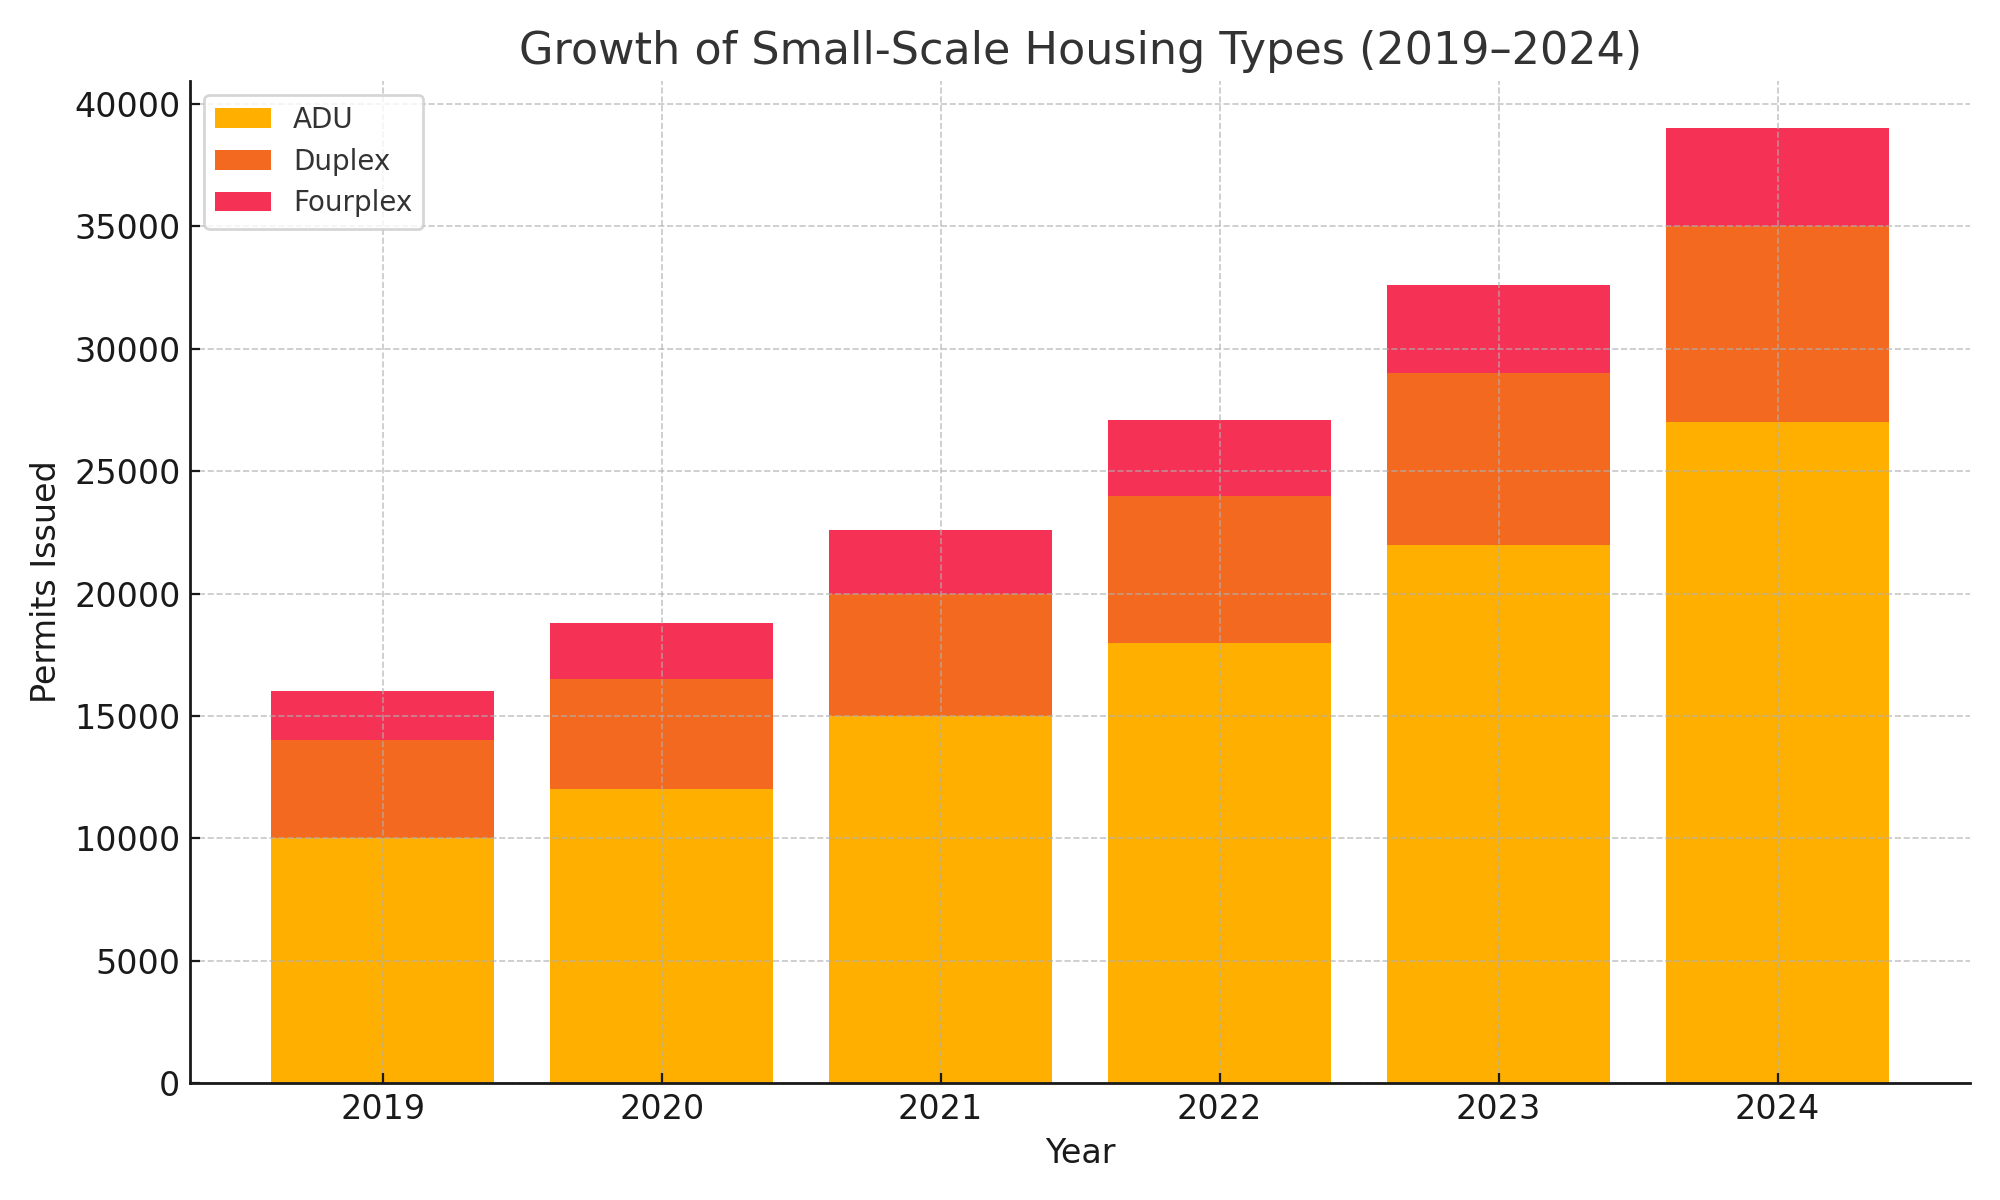
Ask any serious investor where the biggest untapped opportunity lies, and they’ll point to infill development. From ADUs to fourplexes, small-scale construction is finally having its moment—thanks in large part to sweeping zoning reform and growing demand for middle-income housing.
California is leading the way. Between SB-9, ADU streamlining, and state mandates to eliminate single-family zoning, the Golden State has seen a 200%+ increase in ADU permits since 2019. What was once a fringe strategy is now a mainstream tactic.
 And it’s not just California. Oregon, Maine, Minneapolis, and cities like Seattle and Austin are all making it easier to build additional units on formerly single-family lots. This opens the door for small developers to create high-yield, multi-unit properties in prime infill locations—often without rezoning or variances.
From a cost-per-door standpoint, ADUs and triplexes often beat new multifamily construction by a wide margin. You can leverage existing infrastructure, reduce entitlement timelines, and still tap into strong rental demand. Best of all, these projects can often be self-financed or funded through private capital without the need for large institutional debt.
The build-to-rent trend adds another layer. In 2023 alone, over 27,000 new single-family homes were completed as rentals—a 3x increase from 2021. Big players are pouring capital into BTR communities across the Sun Belt. But don’t count yourself out. Small developers can still find opportunity in building duplexes or fourplexes to rent out in growth corridors like Huntsville, Raleigh, or Chattanooga.
For those willing to navigate local permitting and construction complexity, the payoff can be significant. Whether it’s converting a garage into a legal ADU or turning a single-family lot into two duplexes, small-scale development is where innovation meets cash flow.
Top Markets to Watch: Performance, Potential, and Pitfalls
Location is the cornerstone of any real estate strategy—but in today’s volatile market, it’s not enough to simply pick a metro with good headlines. Investors need to drill down into neighborhood-level trends, assess housing supply pipelines, evaluate policy risks, and factor in affordability shifts caused by rising interest rates. The 1–4 unit space thrives where demand fundamentals intersect with favorable price-to-rent ratios, flexible zoning, and economic tailwinds. Below are some data-rich insights into markets that stand out for different reasons.
Top-Performing Markets:
- Charlotte, NC: The metro has experienced a 20% increase in average home prices since 2020, while rents have surged nearly 25% in the same time. Gross rental yields average 7–8%, and new BTR communities are springing up around Lake Norman and University City. Charlotte’s job growth in finance and tech remains above the national average, and its pro-growth zoning policies support infill and ADU development.
- Detroit, MI: Detroit is a cash-flow haven, with gross rental yields exceeding 12% in many zip codes. Median home prices still hover around $80,000, creating a low barrier to entry. Flip investors have reported ROI north of 40% in revitalizing neighborhoods like West Village and Bagley. The city has also invested $100M+ in infrastructure and public-private partnerships to bolster livability.
- Tampa, FL: One of the nation’s fastest-growing metros by population, Tampa saw home values rise 30% from 2019 to 2023. Rents have followed suit, up 22% over the last three years, although increases are moderating. Gross yields remain around 6–7%, and suburban submarkets like Brandon and Riverview are still underbuilt relative to demand. The downside? Insurance premiums in coastal zones can eat into margins.
- Cleveland, OH: With purchase prices often under $100/sq ft and rents that can exceed $1,200 for renovated units, cash-on-cash returns of 10–14% are achievable. BRRRR investors especially favor areas like Old Brooklyn and Tremont. Cleveland’s low eviction restrictions and stable tenant pool add to its appeal for long-term holders.
Emerging Markets:
- Columbus, OH: Intel’s $20B semiconductor plant is driving job creation and housing demand. Since 2021, housing permits have doubled, yet prices remain relatively affordable (~$275K median), making it ripe for infill construction. Rent growth in submarkets like Gahanna and Grove City has outpaced supply, with some areas seeing 6–8% YOY increases.
- Greenville, SC: Population grew by over 20% between 2010–2020 and continues to climb. Rental vacancy sits below 4%, and BTR developers are eyeing suburban tracts. Median home prices (~$310K) are still below national averages, offering room for appreciation. Zoning updates in 2023 allow for more duplex and triplex development near transit corridors.
- Pensacola, FL: Median gross yields in Pensacola range between 8–10%. The area avoided the worst of Florida’s insurance hikes and is drawing both retirees and remote workers. Investor activity has increased 15% YOY according to Redfin data, particularly for properties near downtown and NAS Pensacola.
- Huntsville, AL: Named the fastest-growing city in Alabama, Huntsville has a 0.6% housing vacancy rate and a strong tenant pool driven by NASA, Boeing, and Raytheon. Median rents have climbed 19% since 2020, and housing prices remain modest (~$300K median). Investors are capitalizing on new zoning overlays supporting townhome and fourplex construction.
- Indianapolis, IN: With nearly 11% average gross rental yields and landlord-friendly laws, Indy is among the most reliable markets for small portfolio investors. Neighborhoods like Fountain Square and Irvington are hotbeds for flips and small multifamily acquisitions, with median home price growth of 9% YOY.
| City | Median Price ($) | Avg Rent ($) | Gross Yield (%) | YOY Price Growth (%) | Vacancy Rate (%) |
| Columbus, OH | $275,000 | $1,850 | 8.1 | 6 | 4.2 |
| Greenville, SC | $310,000 | $1,750 | 6.8 | 5 | 3.9 |
| Pensacola, FL | $260,000 | $1,650 | 7.6 | 4.5 | 4.1 |
| Huntsville, AL | $300,000 | $1,700 | 6.8 | 5.2 | 2.8 |
| Indianapolis, IN | $245,000 | $1,600 | 7.8 | 4.7 | 3.7 |
Risky/Overvalued Markets:
- Austin, TX: Once a national leader in home price appreciation, Austin saw a ~7% YOY price decline in 2023 and rising inventory. Median home values peaked at ~$575K but are now falling closer to $520K. Flip ROI has dropped to the single digits, and days-on-market have doubled since 2022. Caution is warranted.
- Boise, ID: Boise’s meteoric rise—nearly 70% home price appreciation from 2020–2022—has reversed course. Prices have dropped 10–12% from their peak, and rent growth has flattened. Many investors are underwater on recent acquisitions, particularly in suburban new-build tracts.
- San Francisco, CA: The median home price is still north of $1.2M, but rents have only modestly recovered post-pandemic. Cap rates are under 4%, and new construction is bogged down by red tape. Population has declined two consecutive years, and short-term rental regulations have tightened.
- Salt Lake City, UT: After 30%+ appreciation during the pandemic, Salt Lake saw pricing corrections of 5–8% in 2023. Flip volumes are down 20%, and BRRRR strategies face financing headwinds as appraisals lag. The city remains desirable long-term, but entry pricing is high relative to rents.
- Phoenix, AZ: Investor activity peaked in 2022, but as of late 2023, home prices declined ~4% YOY. BTR supply is catching up with demand in several submarkets like Buckeye and Surprise. While still a top-10 metro for long-term growth, short-term investors must navigate tighter spreads and slowing rent growth.
The takeaway? It’s no longer enough to target “hot” metros. Real estate cycles are local, nuanced, and dependent on a matrix of variables—from migration trends and job growth to permitting bottlenecks and landlord-tenant law changes. Successful investors must pair big-picture analysis with submarket-specific reconnaissance. That means getting boots on the ground, building local teams, and underwriting every deal as if the market might turn tomorrow.
Ultimately, your market choice should reflect your strategy. Are you hunting for appreciation? Stick to growth corridors with new infrastructure and incoming employers. Looking for cash flow? Head to legacy metros with older housing stock and value-add potential. Chasing build-to-rent? Follow migration maps and zoning reform. And above all: validate the data, question the hype, and plan for multiple exit scenarios.
Your Game Plan: Investor Strategies That Actually Work
Long-Term Rental Investors: Target markets with high rent-to-price ratios and stable employment bases. Focus on cash flow over appreciation. For example, in markets like Cleveland and Indianapolis, where median home prices remain under $175,000 and gross rental yields average over 10%, net cash flow of $300–$600 per unit per month is still achievable. Value-add strategies—such as finishing basements or converting garages to ADUs—can boost returns significantly. Consider markets with less restrictive rent control laws and low property taxes to maximize net operating income (NOI).
Hands-On Flippers: Stick to sub-median price points in stable neighborhoods with strong resale comps. Analyze ARV conservatively and budget for longer hold times. Data from ATTOM shows that average flip times increased to 188 days in 2023, up from 163 days the year prior. Focus on functional upgrades—like open kitchens, new HVAC systems, or adding bedrooms—that have a direct impact on value. Use neighborhood-level comps and market absorption rates to avoid overbuilding for the area. Stay nimble with exit plans in case you need to hold and rent.
BRRRR Practitioners: Identify markets where after-repair appraisals remain strong despite recent price softening. For example, in Pittsburgh, average appraisals post-rehab still support 70–75% cash-out LTVs. Focus on C-class neighborhoods with improving fundamentals and increasing rent comps. Given rate volatility, model both fixed- and adjustable-rate options on your refi, and stress-test the deal for a 1.2–1.3 DSCR minimum. Build relationships with local private lenders to streamline the cash-out phase.
DIY Landlords & House Hackers: Start with a duplex or triplex in markets with strong job growth and moderate regulation. Cities like Milwaukee, Minneapolis, and Boise allow legal ADUs and have programs for first-time buyers. According to Zillow, house hackers in tertiary markets can reduce their living expenses by over 70% by occupying one unit and renting the others. Focus on properties with existing infrastructure for expansion—large garages, basements, or underutilized square footage.
Growth-Oriented Small Portfolio Builders: Build a route to scale using the 1031 exchange, seller-financing, or small commercial loans. In states like Ohio and Missouri, turnkey operators still offer portfolios of duplexes and quads that pencil out at a 9–12% cap rate. Target neighborhoods near hospitals, universities, or new transit hubs. Track NOI growth annually and focus on optimizing property management to reduce operating expense ratios (targeting 35–45%). Use technology to centralize leasing, rent collection, and maintenance coordination.
Final Word: Sharpen Your Strategy or Sit on the Sidelines
This is not the market for lazy investing. Gone are the days when you could buy anything and count on price appreciation to bail you out. In today’s environment, you need to be smarter, more creative, and more operationally excellent than ever before.
But there’s good news: volatility creates opportunity. Investors who sharpen their pencils, build local teams, and commit to operational excellence will continue to outperform. Whether you’re deploying $100k or $100 million, the principles are the same: buy smart, manage well, and stay adaptable.
The U.S. housing shortage isn’t going away. The policy climate is slowly becoming more development-friendly. And demographic demand remains strong. The market is rewarding those who can play the long game.
Frequently Asked Questions
Why are 1–4 unit properties still a strong investment in 2025?
Because the U.S. is still millions of housing units short, demand for quality rentals remains extremely strong. High interest rates have pushed many would-be buyers into long-term renting, while low resale inventory and migration trends are keeping occupancy high. This makes well-located 1–4 unit rentals one of the most resilient and in-demand asset classes in 2025.
How have higher interest rates changed how investors operate in the 1–4 unit space?
Higher rates have pushed investors to be far more disciplined. Deals now require tighter underwriting, more conservative rent assumptions, and multiple exit strategies. Instead of relying on appreciation, investors are stress-testing cash flow, analyzing local submarkets more closely, and focusing on operational excellence to protect margins.
What markets are performing best for 1–4 unit investing right now?
The strongest performers include affordable, landlord-friendly markets such as Detroit, Cleveland, Charlotte, Tampa, and Indianapolis. These cities offer a combination of healthy rent-to-price ratios, strong job growth, and tenant demand. Emerging markets like Columbus, Greenville, Huntsville, and Pensacola are also gaining traction due to new employers, zoning reform, and expanding renter populations.
What strategies are working best for 1–4 unit investors in 2025?
Long-term rentals in high-yield markets, disciplined flipping at sub-median price points, BRRRR in appraisal-friendly metros, and small-scale development (ADUs, duplexes, fourplexes) in zoning-friendly cities are all winning strategies. The key theme: success comes from buying right, operating efficiently, and choosing markets where fundamentals, not hype, drive returns.
Sources
-
ATTOM Data Solutions
-
2024 Year-End U.S. Home Flipping Report
-
Q2 2024 U.S. Home Flipping Report
-
Rental yield and price-to-rent ratio data by county
-
-
Resimpli
-
2024 House Flipping Statistics and Trends
-
-
Redfin
-
YOY investor activity trends (e.g., Pensacola, FL)
-
-
Zillow
-
House hacking savings estimates and ADU trends
-
-
U.S. Census Bureau
-
Housing vacancy rates, population migration, and housing starts
-
-
Local Government Data
-
State and municipal legislation on ADUs, SB-9, zoning reform (California, Oregon, Maine, Minneapolis)
-
-
National Association of Realtors (NAR)
-
Investor share of home purchases and buyer behavior
-
-
Intel
-
Columbus, OH: $20B chip plant investment data
-
-
City of Detroit & Infrastructure Investment Sources
-
Public-private redevelopment initiatives and infrastructure investments
-
-
Local MLS & County Assessor Data (Referenced indirectly)
-
Median home values, flip ROIs, rent levels, and resale trends
-